Learn how to open a dashboard and interact with it by changing dates and filters.
Prerequisites
- Open a dashboard that you would like to work with. Learn how to open a dashboard here.
Tip: The 'Organization' tenant often contains premade dashboards that have been configured by your digital team.
Table of contents
There are a number of ways you can interact with dashboards to make sense of your data. Mastering the three below will get you up and running quickly.
1. Setting the Date Range
Much of the analysis you will do in InfoTiles involves trend analysis, thus selecting a date range over which to observe trends is a fundamental step in making sense of your data.
- Step 1. Click on the calendar icon to open the "Quick Select" wizard.
- Step 2. Select one of the commonly used date ranges provided for convenience
Caution: Be aware that certain data types will not have updates in all date ranges. For example, daily weather updates may not be visible if you select 'Last 15 minutes'. Other data sets may also have a small delay before data is populated in InfoTiles.
More advanced instructions on working with time range.
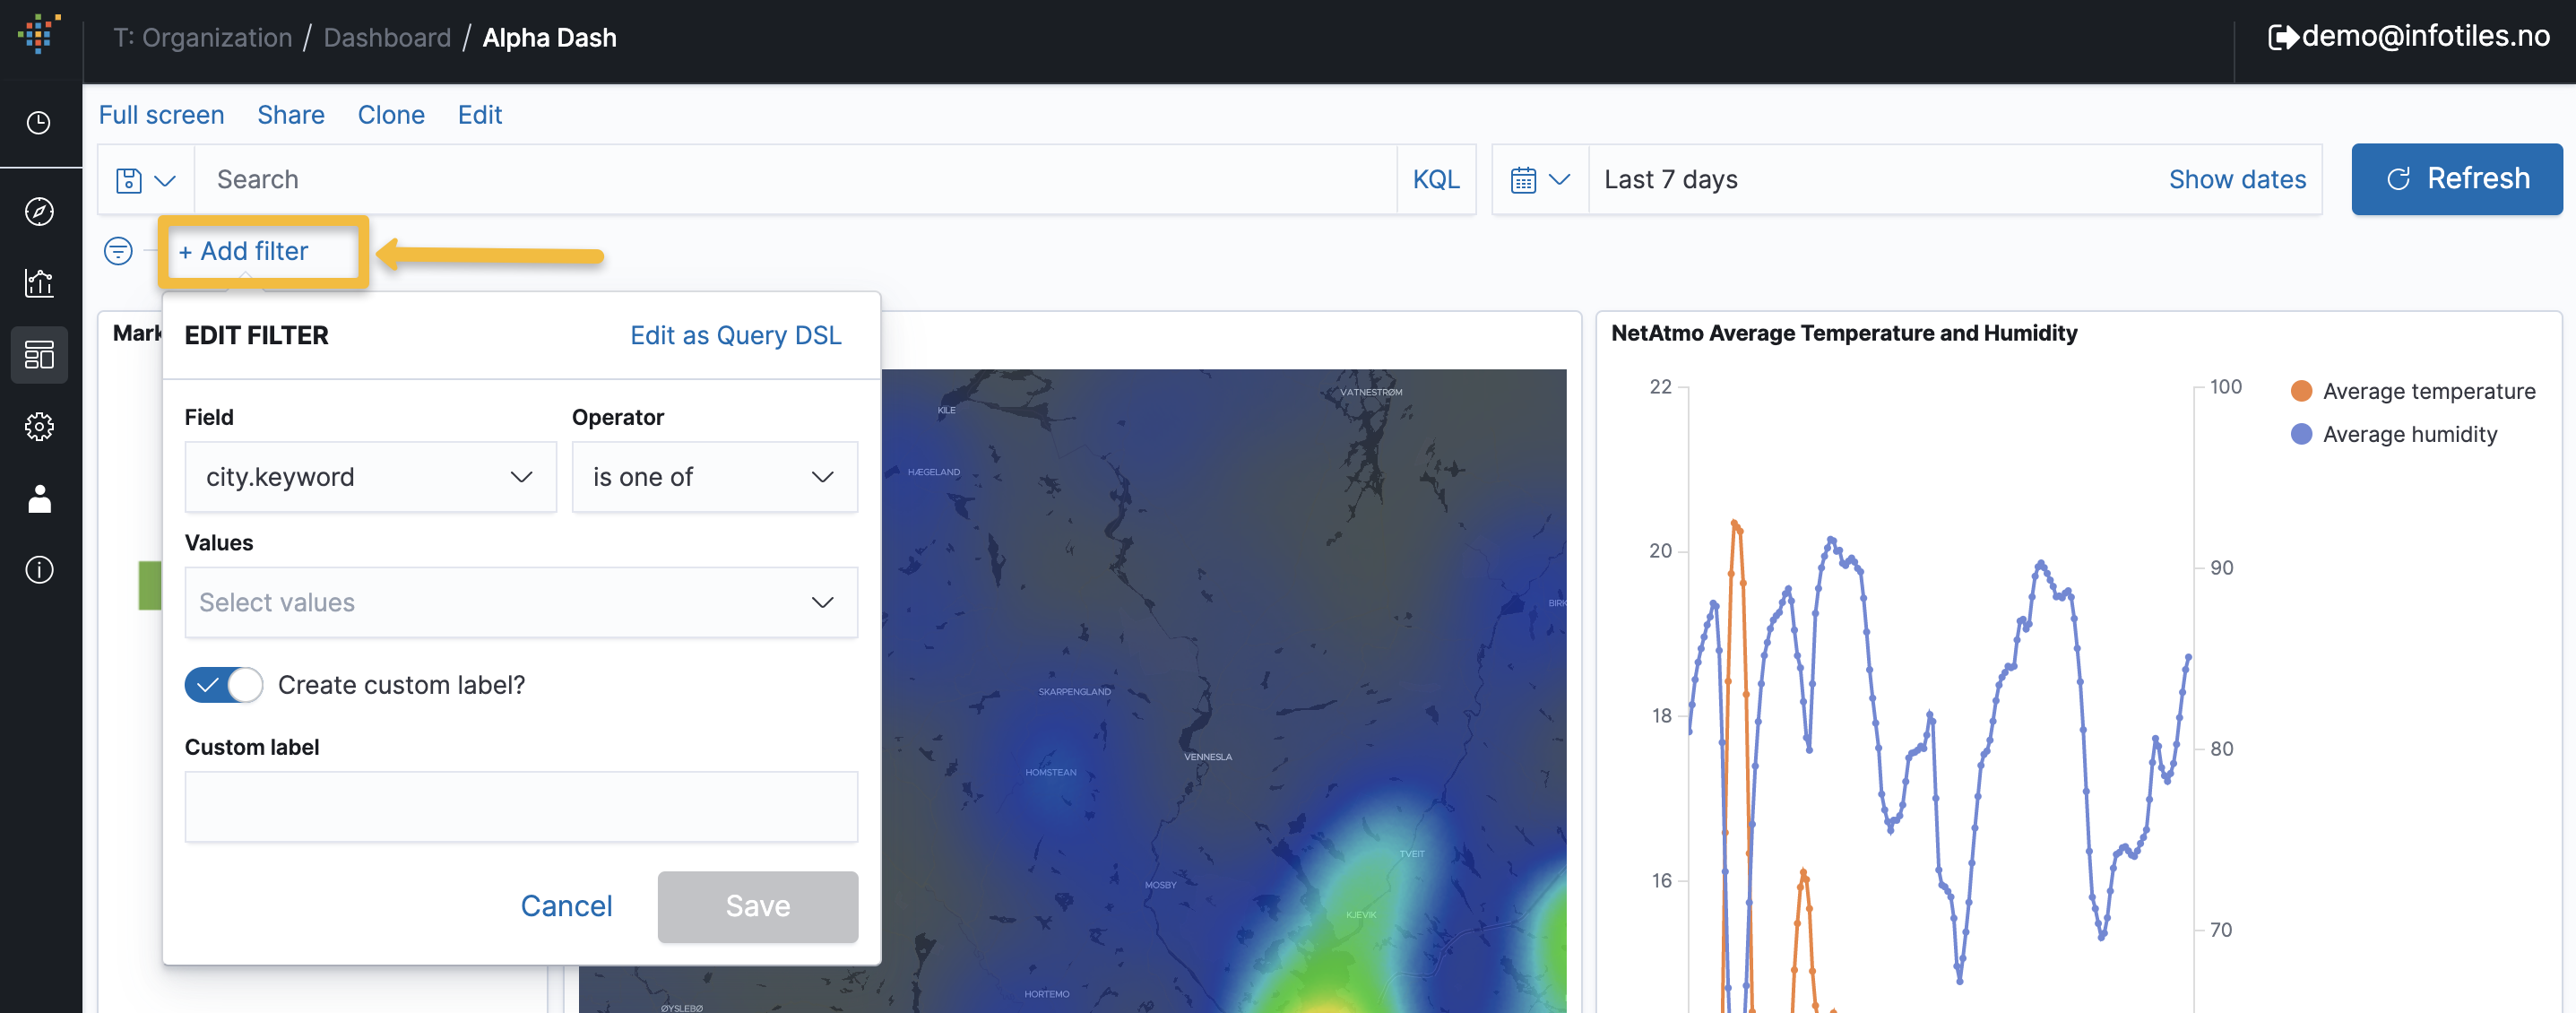
2. Using Filters
A filter is to apply some conditions inside the query to focus on relevant data.
- Step 1. Click Add Filter to open the Filter panel
- Step 2. Select Field, Operator and Values
- Step 3 (optional). Add a custom label to describe the filter. A custom label will help you remove all filter conditions faster.
- Step 4. Click Save to apply to the dashboard
Logical and operator are applied. If a document matches the query, it is returned in the results; otherwise, it is not.
3. Display dashboards full-screen
View the dashboard in full screen to focus on visualizations only.
The recording below show how to display and exit full-screen mode when you are working with a dashboard.
Comments
0 comments
Please sign in to leave a comment.